| .. | ||
| common | ||
| public | ||
| server | ||
| config.ts | ||
| jest.config.js | ||
| kibana.json | ||
| layout.png | ||
| readme.md | ||
| tsconfig.json | ||
Lens
Visualization editor allowing to quickly and easily configure compelling visualizations to use on dashboards and canvas workpads.
Embedding
It's possible to embed Lens visualizations in other apps using EmbeddableComponent and navigateToPrefilledEditor
exposed via contract. For more information check out the example in x-pack/examples/embedded_lens_example.
Testing
Run all tests from the x-pack root directory
- Unit tests:
yarn test:jest x-pack/plugins/lens - Functional tests:
- Run
node scripts/functional_tests_server - Run
node ../scripts/functional_test_runner.js --config ./test/functional/config.js --grep="lens app" - You may want to comment out all imports except for Lens in the config file.
- Run
- API Functional tests:
- Run
node scripts/functional_tests_server - Run
node ../scripts/functional_test_runner.js --config ./test/api_integration/config.ts --grep=Lens
- Run
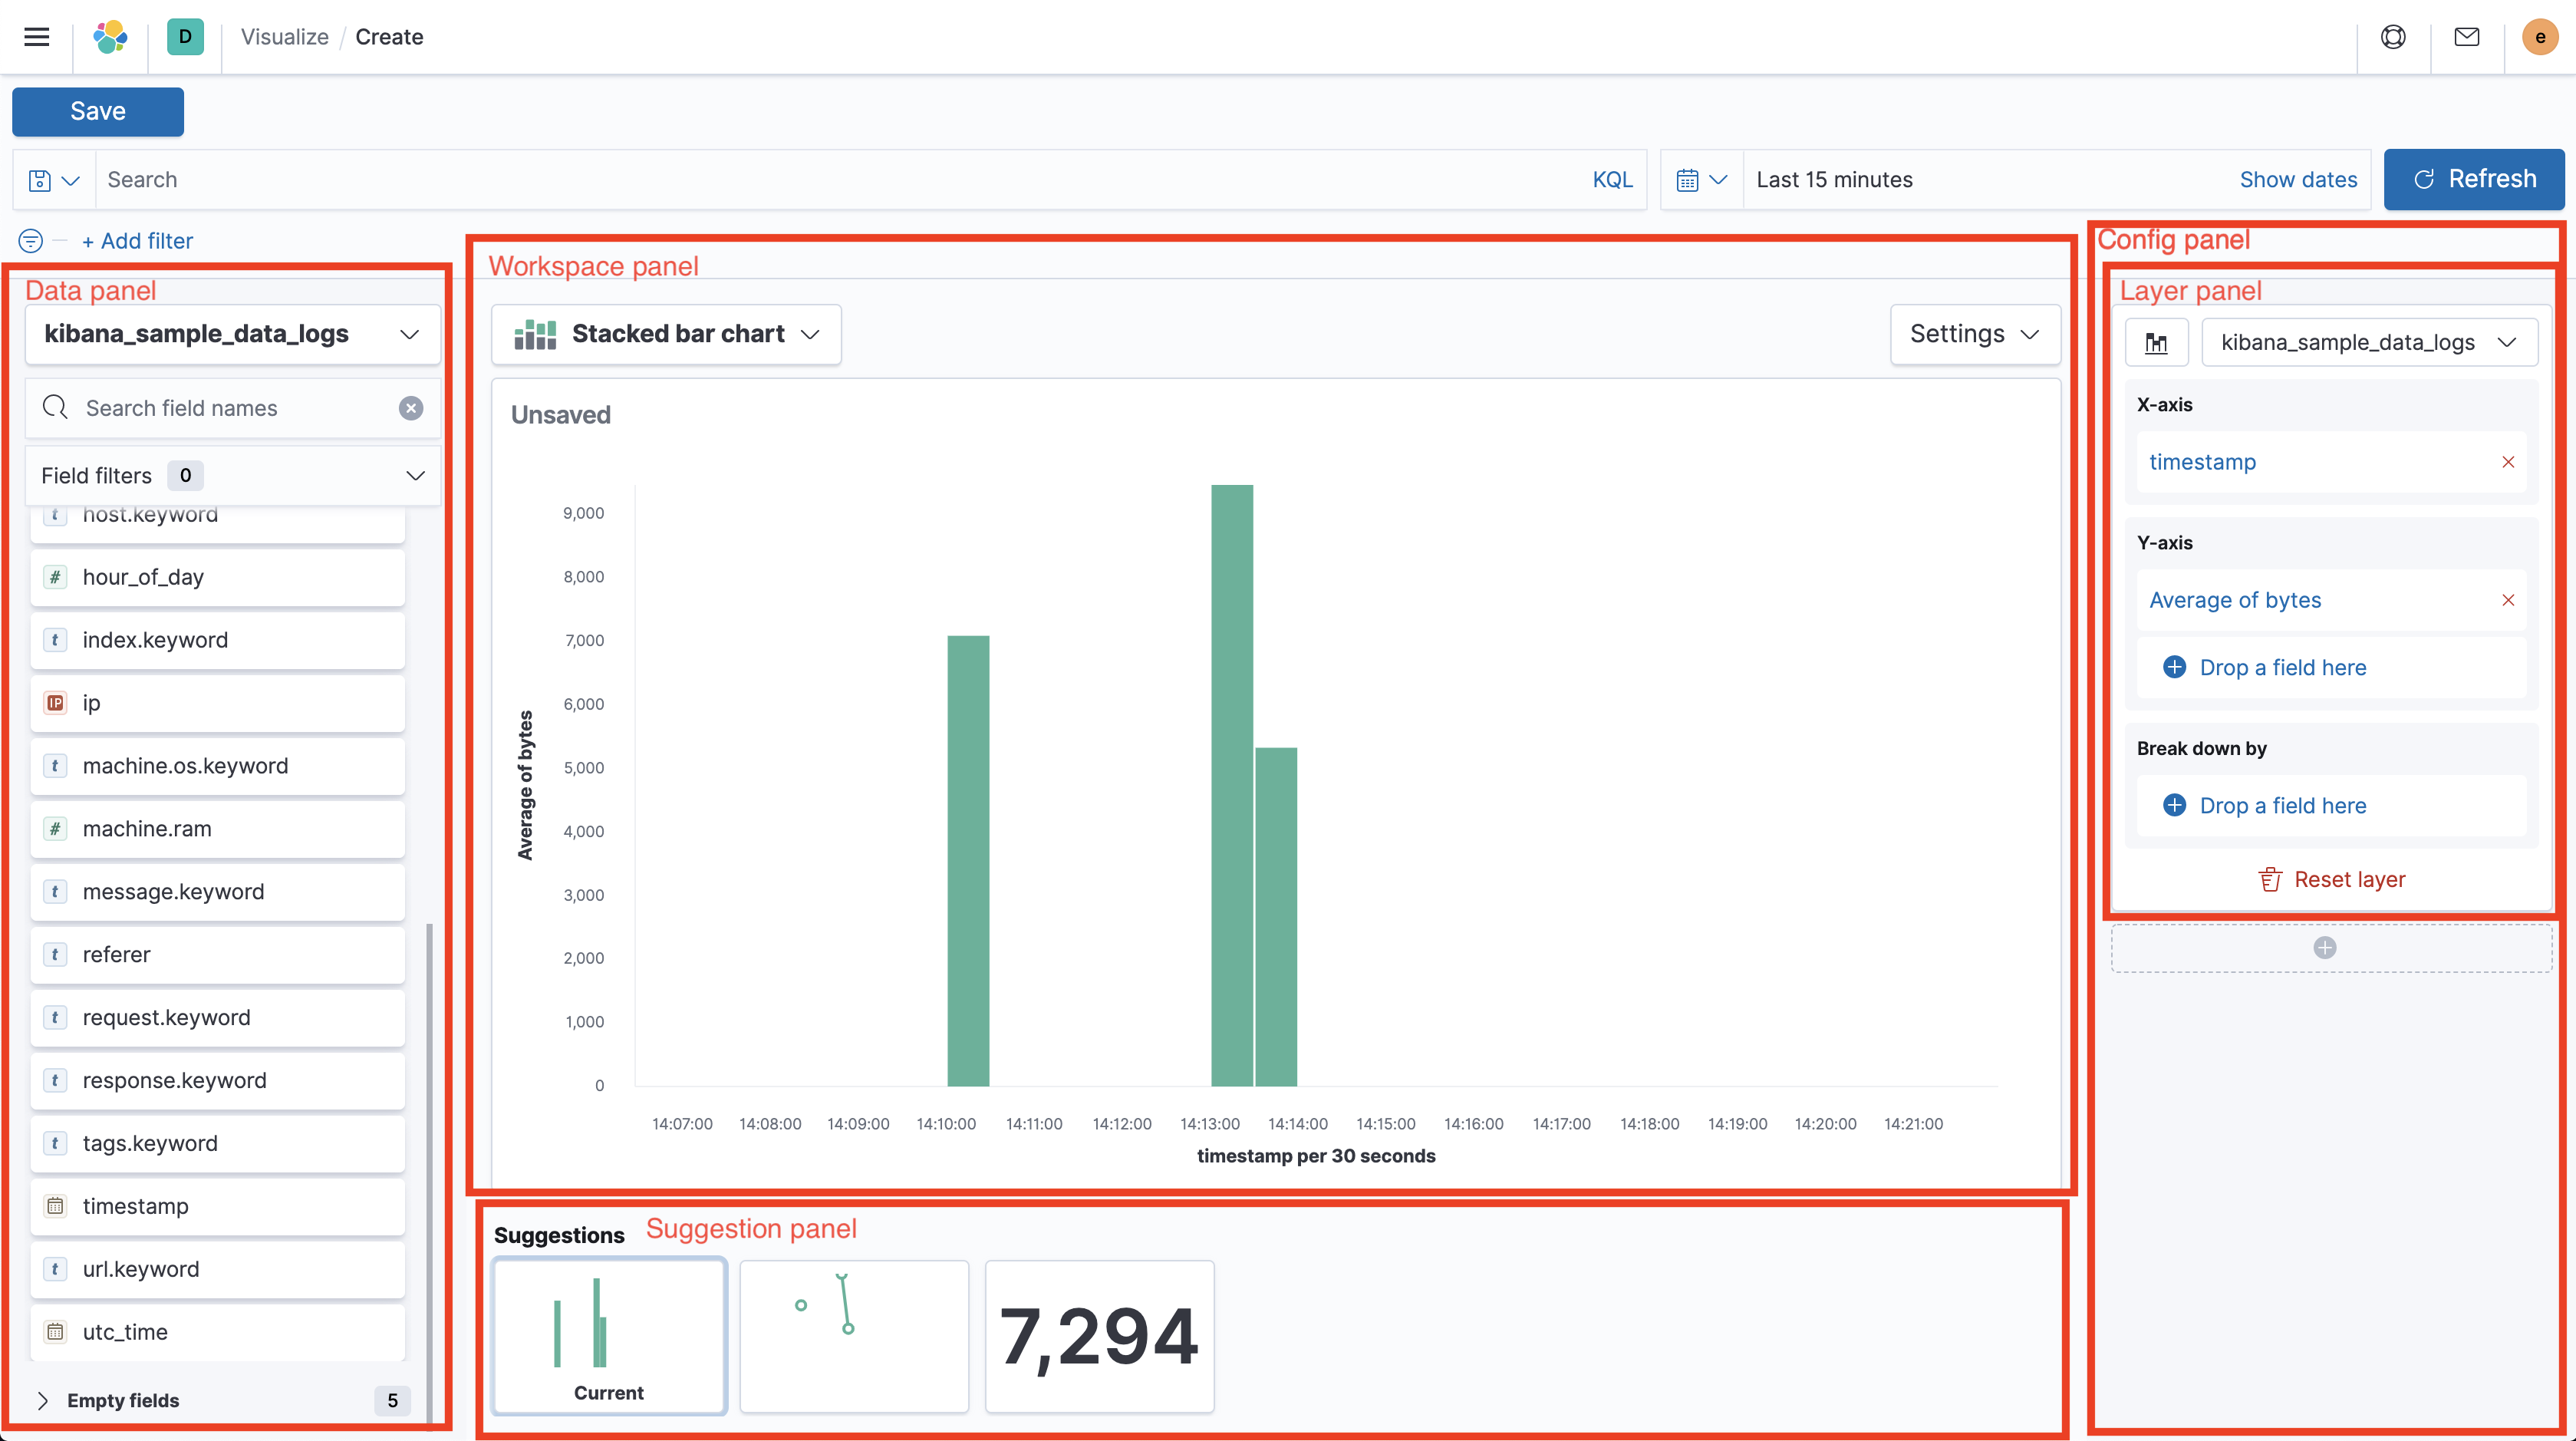
UI Terminology
Lens has a lot of UI elements – to make it easier to refer to them in issues or bugs, this is a hopefully complete list:
- Top nav Navigation menu on top of the app (contains Save button)
- Query bar Input to enter KQL or Lucene query below the top nav
- Filter bar Row of filter pills below the query bar
- Time picker Global time range configurator right to the query bar
- Data panel Panel to the left showing the field list
- Field list List of fields separated by available and empty fields in the data panel
- Index pattern chooser Select element switching between index patterns
- Field filter Search and dropdown to filter down the field list
- Field information popover Popover showing data distribution; opening when clicking a field in the field list
- Config panel Panel to the right showing configuration of the current chart, separated by layers
- Layer panel One of multiple panels in the config panel, holding configuration for separate layers
- Dimension trigger Chart dimension like "X axis", "Break down by" or "Slice by" in the config panel
- Dimension container Container shown when clicking a dimension trigger and contains the dimension settints
- Layer settings popover Popover shown when clicking the button in the top left of a layer panel
- Layer panel One of multiple panels in the config panel, holding configuration for separate layers
- Workspace panel Center panel containing the chart preview, title and toolbar
- Chart preview Full-sized rendered chart in the center of the screen
- Toolbar Bar on top of the chart preview, containing the chart switcher to the left with chart specific settings right to it
- Chart switch Select to change the chart type in the top left above the chart preview
- Chart settings popover Popover shown when clicking the "Settings" button above the chart preview
- Suggestion panel Panel to the bottom showing previews for suggestions on how to change the current chart
