2.7 KiB
Debugging Miscellanea
This file contains notes about debugging various items in the repository.
Setting breakpoints in Visual Studio for Cascadia (packaged) application
If you want to debug code in the Cascadia package via Visual Studio, your breakpoints will not be hit by default. A tweak is required to the CascadiaPackage project in order to enable this.
- Right-click on CascadiaPackage in Solution Explorer and select Properties.
- Change the Application process type from Mixed (Managed and Native) to Native Only.
Popping into the Debugger from Running Code
Sometimes you will encounter a scenario where you need to break into the console or terminal code under the debugger but you cannot, for whatever reason, do so by launching it from the beginning under the debugger. This can be especially useful for debugging tests with TAEF which usually launch through several child processes and modules before hitting your code.
To accomplish this, add a DebugBreak() statement somewhere in the code and ensure you have a Post-Mortem debugger set.
NOTE: conhost.exe already has a provision for a conditional DebugBreak() very early in the startup code if it was built in debug mode. Set HKCU\Console with DebugLaunch as a REG_DWORD with the value of 1.
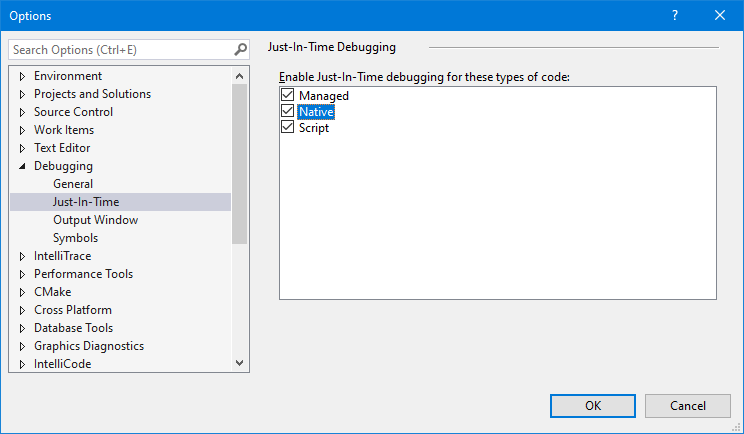
Setting Visual Studio as Post Mortem Debugger
Go to Tools > Options and then make sure that Native is checked as the Just-In-Time Debugging provider. (Checking the box, if it is not checked, will require that Visual Studio is launched as Administrator.)
Then when you run something with DebugBreak() in it, you will see this:
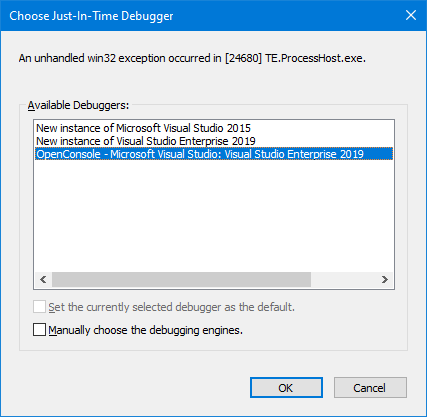
The top ones will be new instances of the Visual Studios installed on your system. The bottom ones will be the running instances of Visual Studio. You can see in the image that one is open already. If you choose the bottom one, VS will attach straight up as if you F5'd from the solution at the point from the DebugBreak(). Step up to get out of the break and back into the code.
Setting WinDBG as Post Mortem Debugger
From an elevated context (a command prompt or whatnot...), run windbg /I. This will install the debugger as Post Mortem.
Then run the thing and it will pop straight into a new WinDBG session. Step up to get out of the break and back into the code.
Caveat: If you are on an x64 system, you may need to do windbg /I with both the x64 and x86 versions of the debugger to catch all circumstances (like if you're trying to run x86 code.)